Exporting
Open the export panel with the Save button in the top right, or Ctrl/Cmd+S.
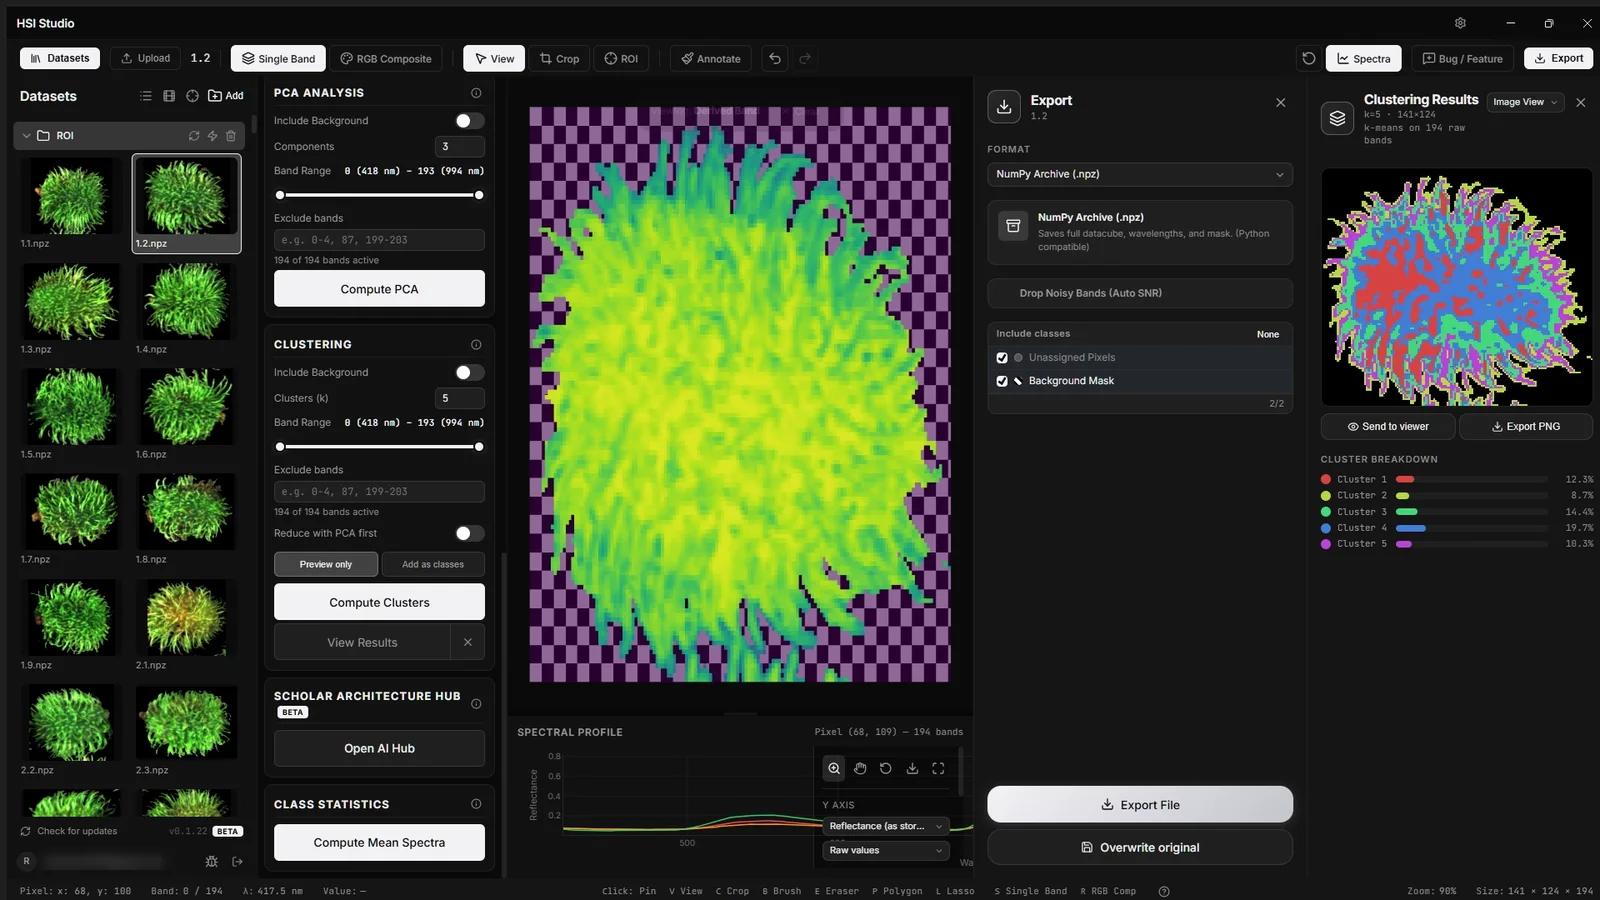
Exports reflect the current state of the cube: if you've cropped, you export the crop; if you've applied a derived band or removed bands, that's what's written. Display settings — colormap, contrast, gamma — affect only the image exports.
Project
| Format | Contents |
|---|---|
HSI Studio Project (.hz) | Full session: view state, mask, ROIs, classes. Reopen to pick up exactly where you left off |
JSON (.json) | Human-readable metadata, mask, classes, ROIs and data. Re-importable, and readable by anything |
Full datacube
| Format | Contents |
|---|---|
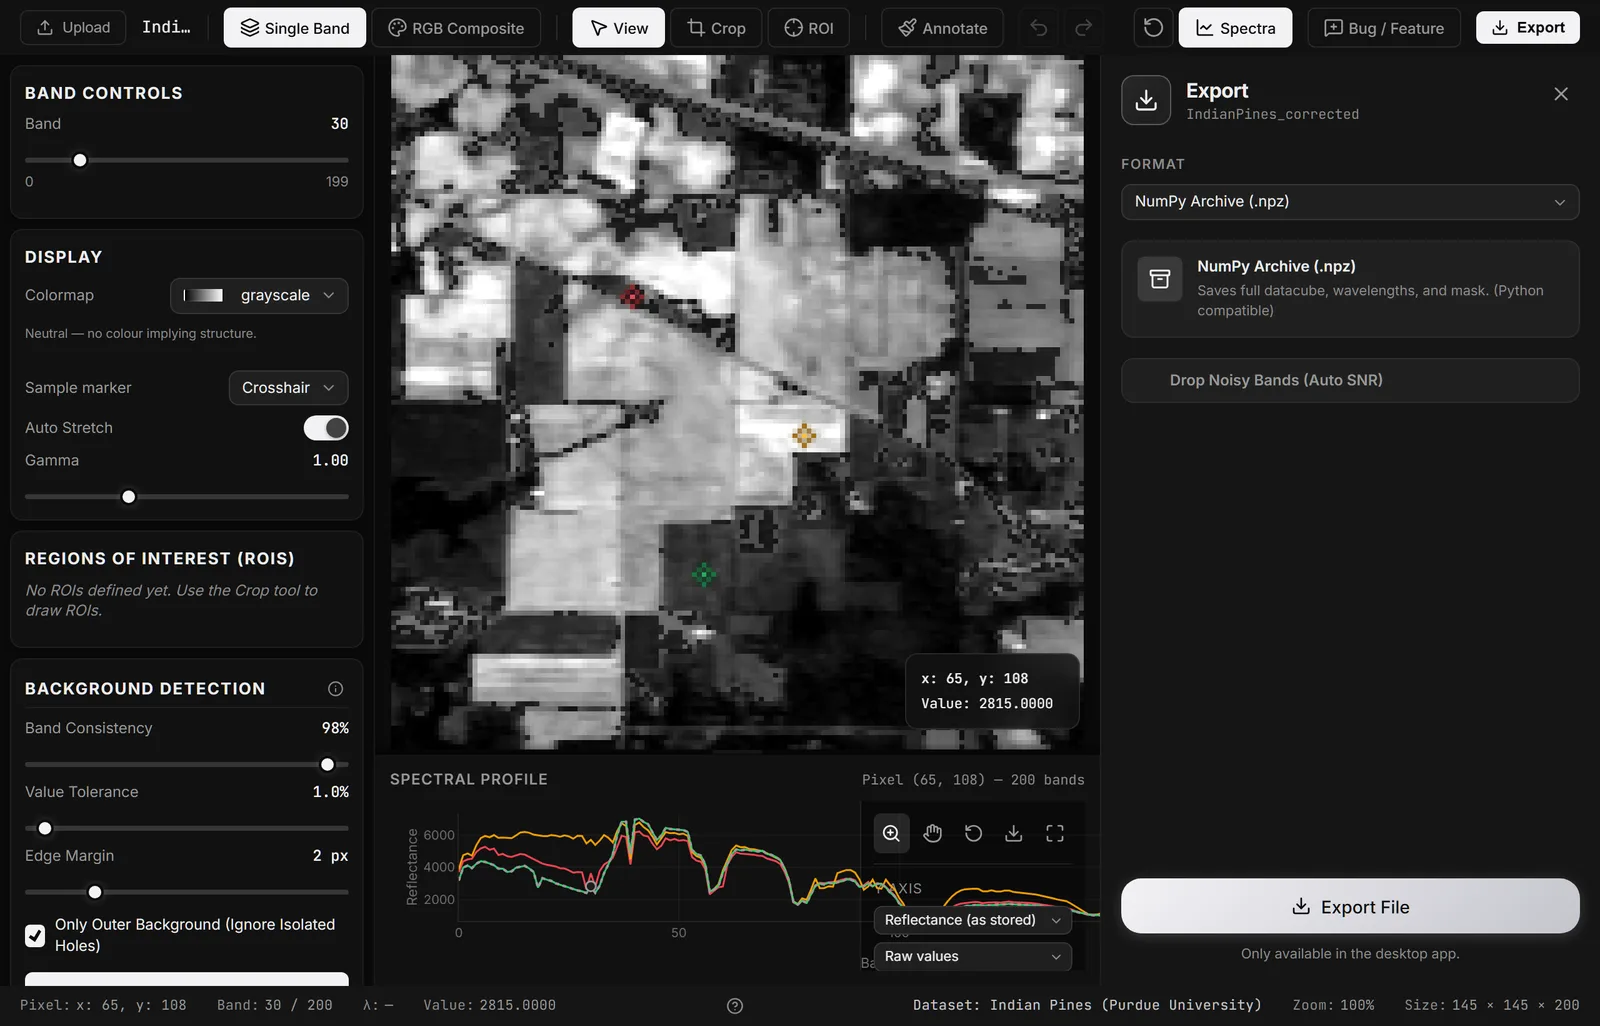
NumPy Archive (.npz) | Datacube, wavelengths and mask. Loads in Python with numpy.load |
ENVI (.hdr + .dat) | The standard interchange format — ENVI, MATLAB, and most remote sensing tools |
Pixel-wise Data (.csv) | One row per pixel, one column per band, plus a class column when a mask exists |
The CSV export offers three class-column layouts:
- Class id + name (recommended) — a numeric
Classcolumn plus aClass_Namecolumn. Re-imports cleanly. - Class id only — a single numeric
Classcolumn. - Class name only — a single
Classcolumn holding the name.
You can also set the name used for unannotated pixels.
Be aware of the size: a 512 × 512 cube with 200 bands is over 26 million numbers. CSV is convenient for a subset or a set of ROIs, and unwieldy for a whole cube — prefer NPZ or ENVI for full cubes.
Image export
| Format | Contents |
|---|---|
| Current View (PNG) | Exactly what's on the canvas — the current band or RGB composite, with your colormap and contrast applied |
Mask export
| Format | Contents |
|---|---|
| Annotation Mask (PNG) | Greyscale image; white is annotated, black is background |
| Annotation Mask (NPZ) | The mask as a NumPy array |
| Annotation Mask (Raw) | Raw binary, no header |
ROI export
Batch ROI export writes each region of interest as its own file. Configure in Preferences:
- Output — a folder, or a single zip.
- Naming convention — default
{imagename}_{roi_name}. - Subfolder — create one per source image, or write flat.
- Location — a chosen directory, or alongside the source file.
Spectral plot export
The spectral plot exports independently of the cube: a vector graphic for publication, or CSV of the plotted spectra. Pinned spectra are exported with their labels.
Auto band removal on export
The export panel can apply auto band removal on the way out, with a threshold you set and a preview of which bands would be dropped — so you can write a cleaned cube without modifying your working session.