The Viewer
The viewer is a WebGL2 canvas that renders the datacube directly from a texture, so band changes, contrast adjustments and colormap switches are immediate even on large cubes. Nothing is re-decoded on the CPU when you scrub bands.
Layout
| Region | Contains |
|---|---|
| Top bar | Tool selection, view mode, save |
| Left sidebar | Band slider, view mode, colormap, contrast, classes, ROIs |
| Canvas | The datacube, zoom and pan |
| Bottom | Spectral plot (when a pixel is selected), timeline (for time series) |
| Status bar | Cursor position, pixel value, cube dimensions |
Viewing bands

Single-band mode (S) shows one band at a time, mapped through a colormap. Scroll the mouse wheel over the image or drag the band slider to move through the spectrum. When the header carries wavelengths, the slider reports nanometres alongside the band index.
RGB composite mode (R) maps three bands to the red, green and blue channels. On entering RGB mode HSI Studio picks the bands nearest 650 nm, 550 nm and 450 nm for a true-colour render; if the cube has no wavelength metadata it falls back to evenly spaced bands. Remap any channel to any band to build false-colour composites — NIR in red is the classic vegetation view.
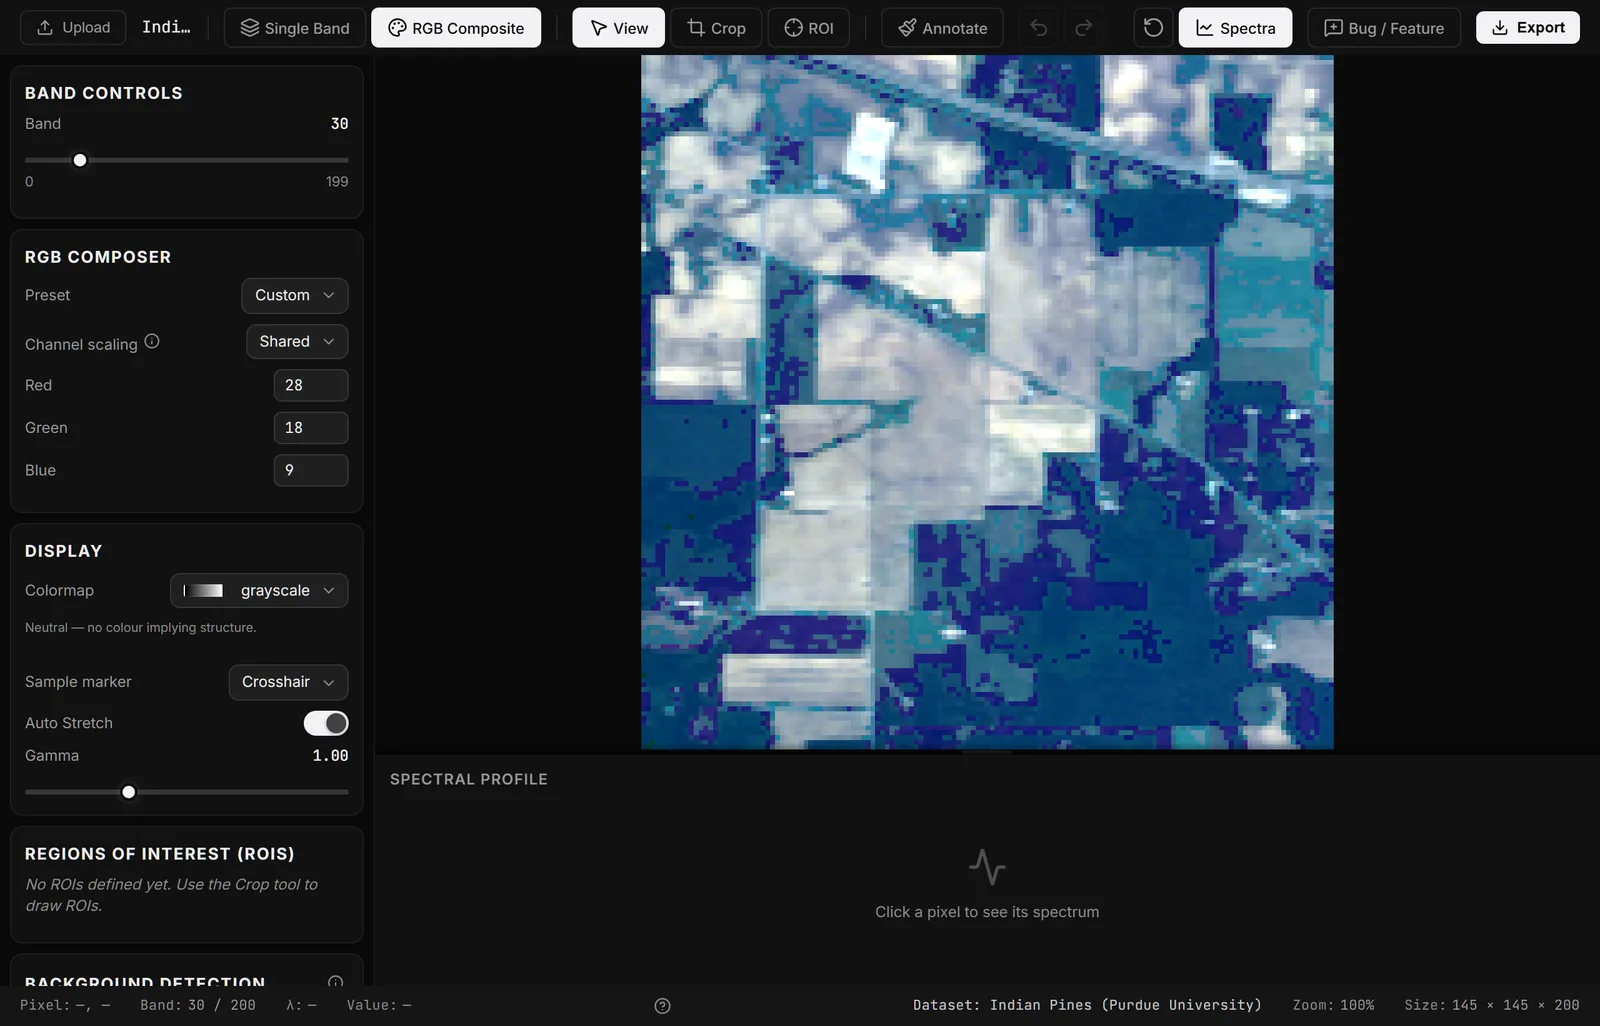
RGB has two stretch modes:
- Shared — one contrast range across all three channels. True colour stays faithful, because the relative brightness between channels is preserved.
- Per band — each channel stretched independently. Maximises contrast, at the cost of colour fidelity. Useful for false colour, misleading for true.
Colormaps
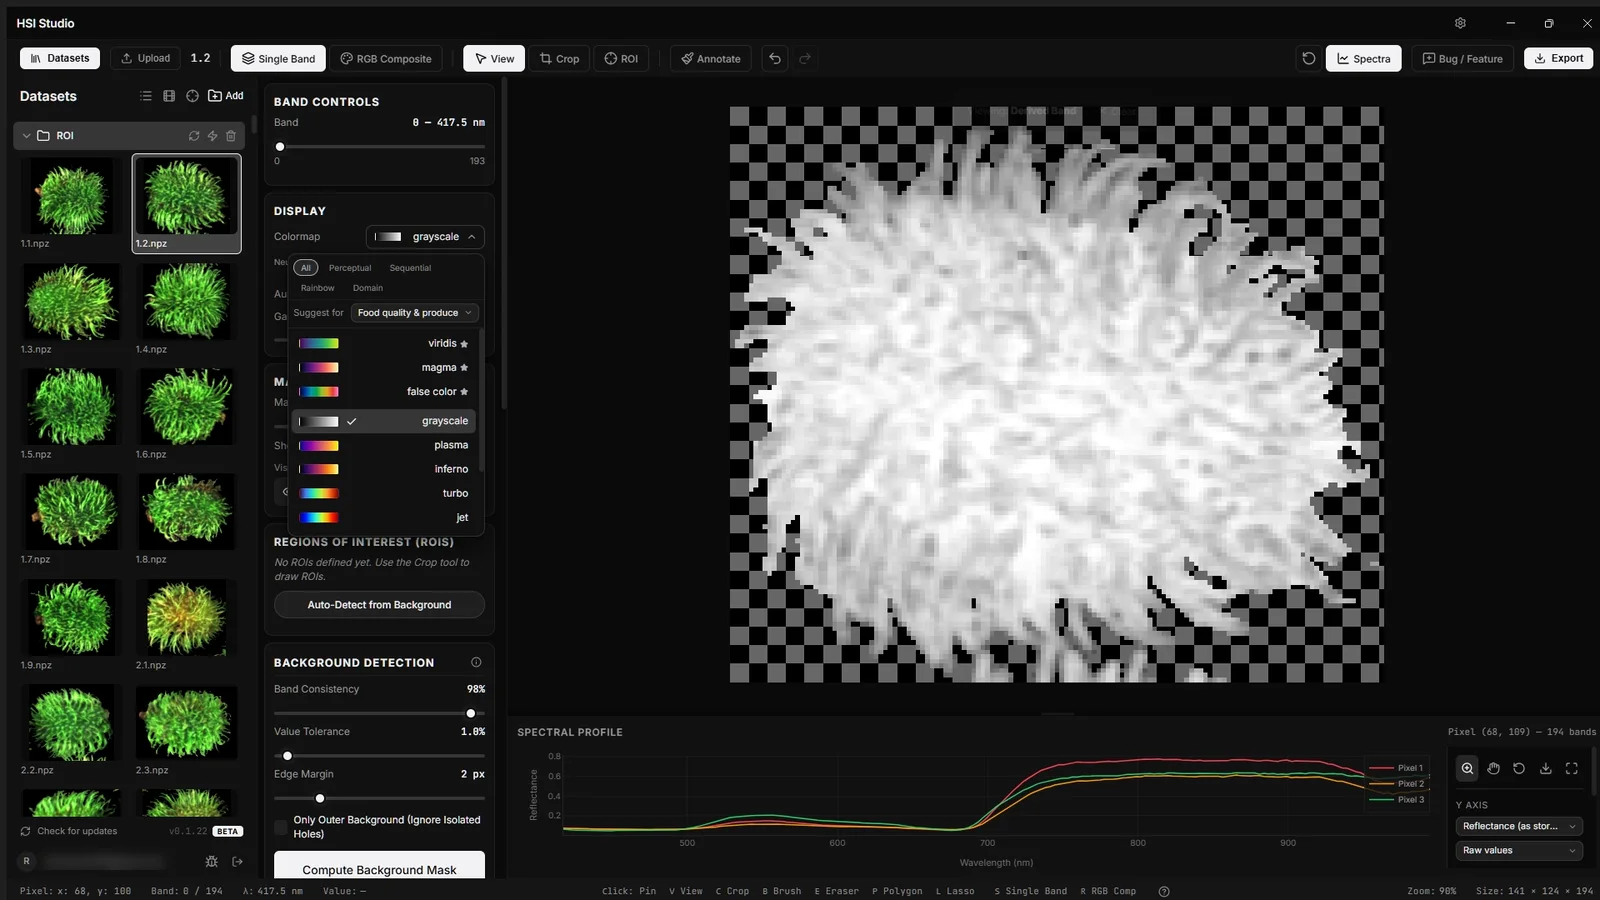
Twelve colormaps ship: grayscale, viridis, plasma, inferno, magma, turbo, jet, hot, cool, spring, bone, and false color.
viridis, plasma, inferno and magma are perceptually uniform — equal steps in data are equal steps in perceived brightness, and they survive being printed in greyscale or read by a colour-blind viewer. jet and turbo are higher contrast but introduce banding artefacts that aren't in the data; prefer them for spotting fine structure, not for figures.
Contrast
- Auto stretch (on by default) rescales the display to the actual min and max of the current band, so every band is legible regardless of its dynamic range.
- Turning it off exposes min, max and gamma sliders for manual control. Gamma below 1 lifts the shadows; above 1 deepens them.
Contrast is a display transform only. It never alters the underlying data, and exports of the cube are unaffected — only the "Current View (PNG)" export reflects what you see.
Zoom and pan
- Zoom —
Ctrl/Cmd+ scroll wheel, or a trackpad pinch. A plain scroll changes the band instead, so zooming always needs the modifier. - Pan — drag with the middle mouse button, hold
Spaceand drag, orShift+ drag while the View tool is active. - Reset view — press
Z.
Time series
When a dataset contains multiple captures of the same scene, HSI Studio can load them as frames of a time series. A timeline appears below the canvas; stepping through frames keeps the current band, colormap, contrast, mask and classes, so you can compare the same wavelength across captures.
Keyboard shortcuts
These are bare single-key presses — they're ignored while you're typing in a field, and ignored when a modifier is held so system chords keep working.
| Key | Action |
|---|---|
V | View / pan tool |
B | Brush |
E | Eraser |
P | Polygon |
L | Lasso |
C | Crop / rectangle |
S | Single-band view |
R | RGB composite view |
Z | Reset zoom and pan |
[ or - | Decrease brush size |
] or + | Increase brush size |
Ctrl/Cmd + S | Open the export panel |
Ctrl/Cmd + Z | Undo the last mask edit |
Ctrl/Cmd + Y or Shift+Ctrl/Cmd+Z | Redo |
Esc | Cancel the current interaction |
Desktop-only menu accelerators:
| Key | Action |
|---|---|
Ctrl/Cmd + O | Open datacube |
Ctrl/Cmd + Shift + O | Import dataset folder |
Ctrl/Cmd + W | Close datacube |
Ctrl/Cmd + B | Batch operations |
Ctrl/Cmd + , | Preferences |